
“In God we trust, all others must bring data”: Introducing BA DS students to quantitative data analyses, R programming and Big Data
 By Eliyahu Sapir & Thomas Frissen
In January 2021, second-year BA Digital Society students followed an intensive introduction to big data analysis. Students were trained in quantitative data analyses and using R and RStudio in an earlier course. They employed these skills to analyse data they harvested from Twitter and carried out a sentiment analysis in the aftermath of the January 6 storming of the US Capitol.
The course was delivered for the first time and had the expected, steep learning curve for staff and students. It is, unfortunately, a matter of common knowledge that statistics and quantitative research are not much loved by Social Science/Humanities students. Programming languages and big data analytics are probably ranked even lower. The challenge was to enable students to get acquainted with quantitative research, obtain big data, design their independent sentiment analysis, conduct the required statistical analyses and deliver their findings within a total of 9 weeks of training and group-work.
“So, why bother at all?!” you may ask. For one, the demand for professionals with programming and quantitative skills in the labour market has skyrocketed in recent decades. Within academe, the “computational turn” provides opportunities for social researchers to address theoretically informed research questions employing advanced computational and statistical skills. Furthermore, the availability of large volumes of digital data characterising all aspects of social life as well as major developments in quantitative methods in the last few decades allow us to explore new realms of social interaction, political participation, economic behaviour and so much more.
From Quantitative Data Analysis to Working with Big Data
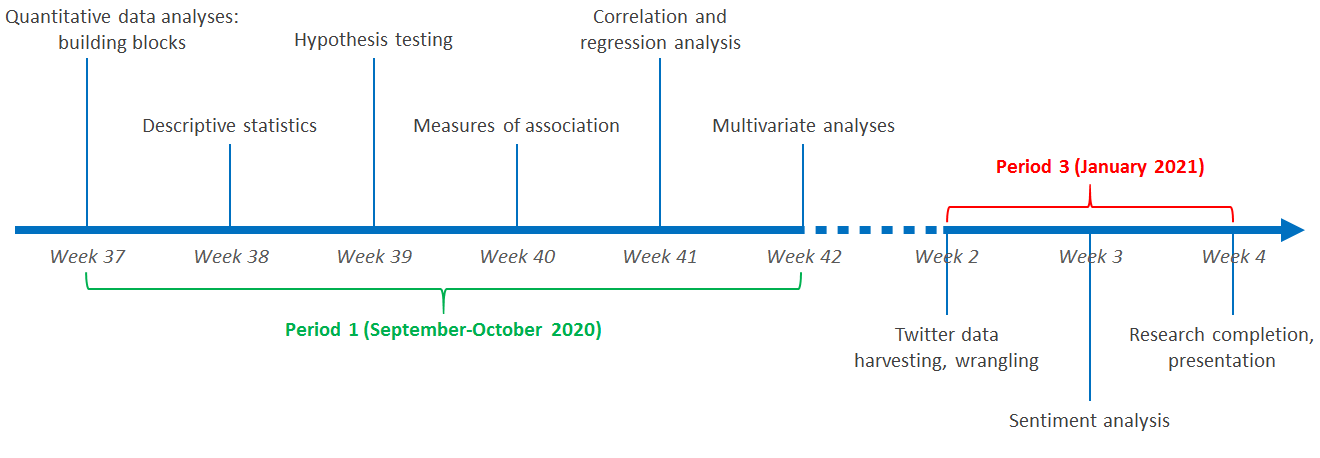
During period 1, students followed Quantitative Data Analysis (QDA), in which they were trained in different statistical analyses techniques and methods and in using R. This course covered the building blocks of quantitative research, descriptive and inferential statistics, as well as data visualisations. Every week students followed a lecture (statistical theory and methods), and two tutorials (R programming and hands-on exercises in data analysis). As indicated in the left-hand side of the timeline below, by the end of the course they were introduced to designing their own multivariate analyses.
Big data analytics: Sentiment analysis of tweets
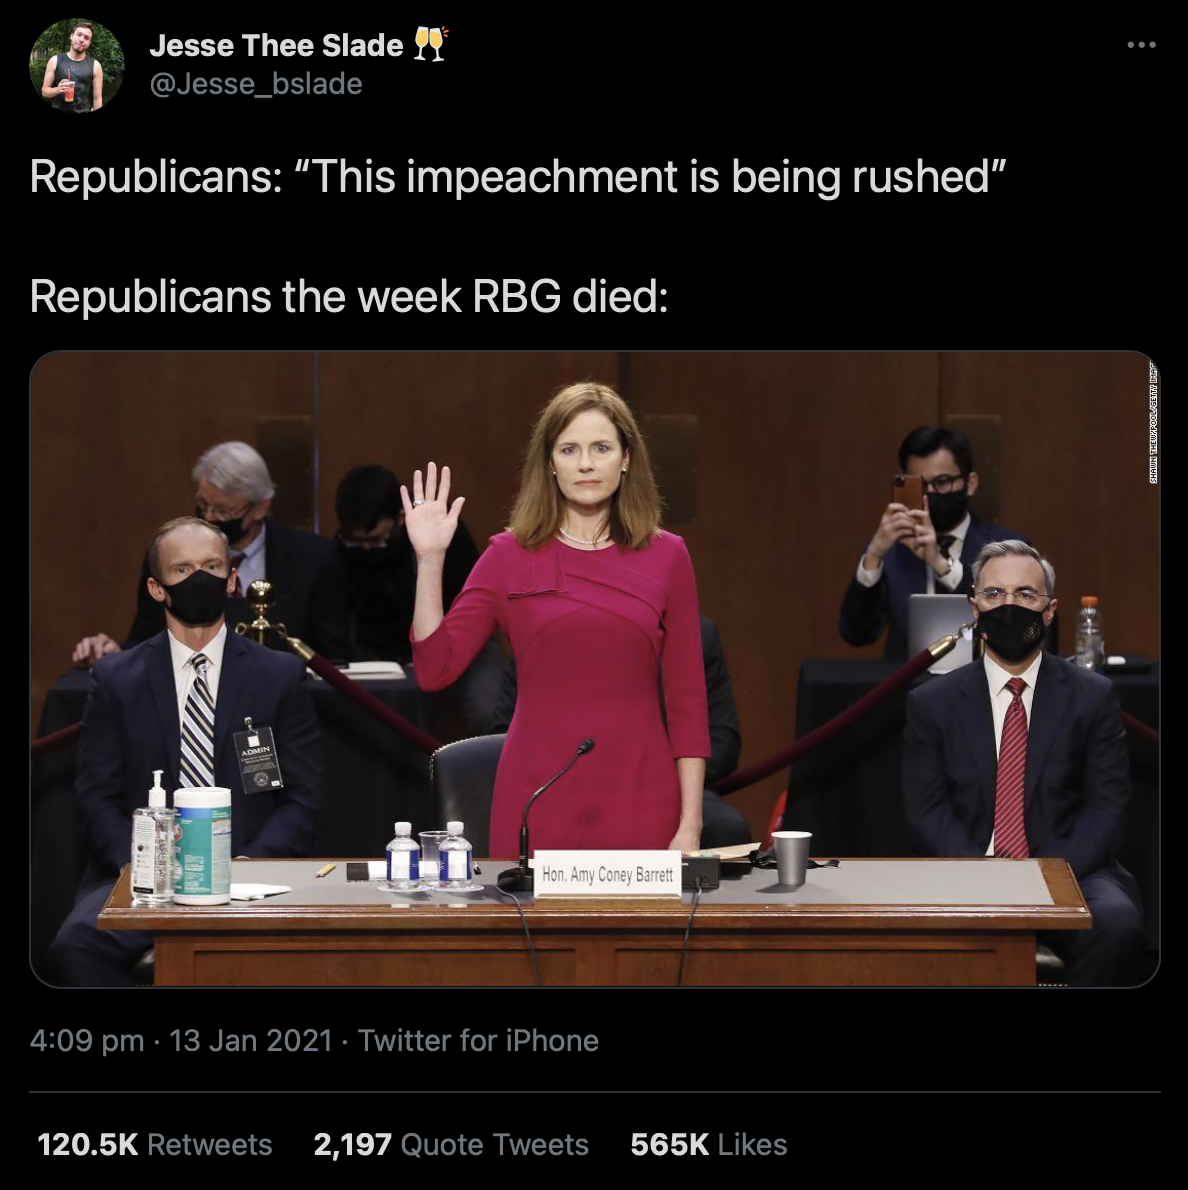
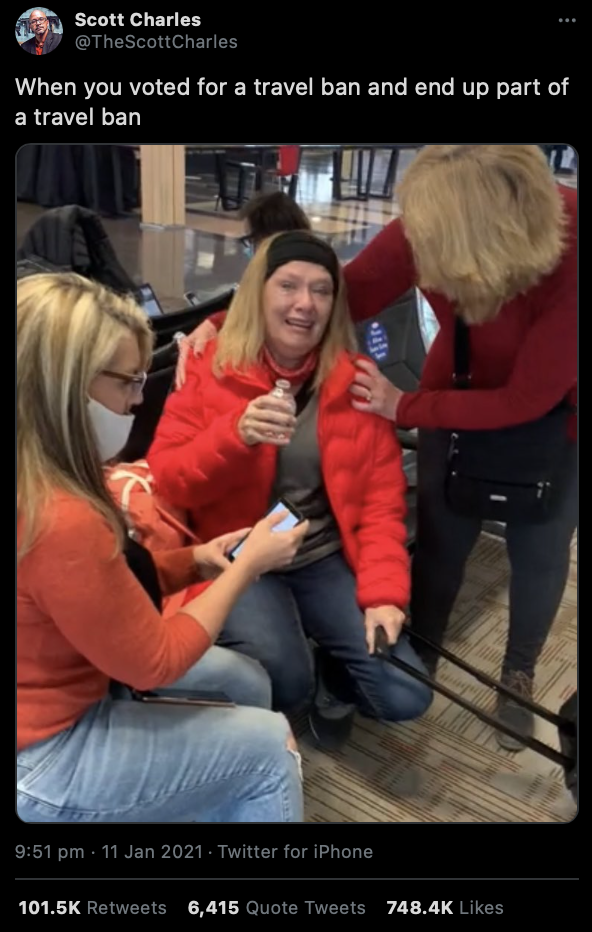
Working with Big Data (WBD) was planned so that students engage with data about current, topical issues. In this course, students followed a weekly lecture, two tutorial meetings. Working groups of 3-4 students met their tutor every week to discuss progress. In the introductory lecture, students were told that we would finalise the topics by the end of the week 1, based on data (i.e. tweets) availability. Our original plan was to focus either on the Coronavirus vaccination or the new WhatsApp privacy policy, but then… three hours after the end of this lecture, rioters in Washington DC stormed the Capitol and defined the focus of WBD’s research for us.
Data harvesting and wrangling
In the second week, each of the 12 working groups harvested one million tweets pertaining to the Capitol riots. The process took several hours, sometimes a whole night to complete, as Twitter’s Application Programming Interface (API) only allows downloading tweets in batches of 18,000 at a time, with a 10-15 minutes break between download cycles. The dataset included 90 variables, with information about the tweets and their generating accounts. These data were next cleaned and prepared for data derivations and analyses. Cleaning included removing numbers, punctuation, emoji’s and line-breaks, and removing stop-words (“and”, “the”, etc.)
Sentiment analysis
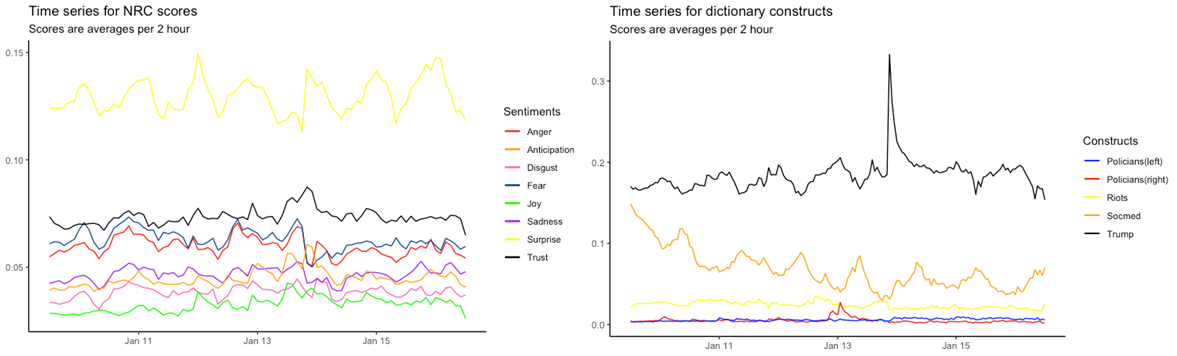
Sentiment data, i.e. tweets automatically processed to interpret expressed sentiments, were derived the following week. Students used the VADER and NRC packages, developed as content-analysis algorithms to detect positive/negative/neutral sentiments and the salience of four positive and four negative emotions within textual data. Additionally, students developed their own dictionaries to gauge theoretical constructs used to model tweets’ sentiments. For example, the two line-plots below show distribution of emotions and other constructs in students’ sample across time.
Students used the final week to write their papers and design their presentations. On presentation day, they had eight minutes to present the results of their research. They received feedback from the discussant, Sally Wyatt.
There were several challenges: time (only three weeks…), logistics (both QDA and WBD were fully online; students’ computers were not strong enough to handle millions of tweets. Seriously. We need stronger computers!), and Covid-19 distance learning. Nonetheless, students’ presentations were thought-provoking, and demonstrated how they could use substantive training and quantitative skills to conduct theoretically informed big data analyses.
There is a need to establish a robust link between statistical theory covered in multiple resources and hands-on (big) data engagement. We reviewed many statistics textbooks, but none were optimal for the needs of students in at FASoS, adequate for the short periods in our curriculum, or flexible enough to support various types of quantitative analyses employing different software. We are currently at the early stages of developing a proposal for a textbook to address these points. So, to be continued!
About the authors
Eliyahu Sapir is Assistant Professor in Social Science Research Methods and coordinator of the European Studies Minor. Eliyahu’s methodological interests span a range of issues related to statistical analysis and big data analytics, concerning, for instance, comparative political behaviour and EU public opinion. He co-developed, and coordinated and taught QDA and WBD.
Thomas Frissen is Assistant Professor in Digital Technology and Society. He teaches and co-develops multiple courses in the Bachelor Digital Society. Thomas is passionate about the interrelations between digital media and all kinds of extreme or uncanny phenomena and uses a research toolbox that consists of classical and digital social scientific research methods.


[…] the latest contribution to the FASoS Teaching & Learning Blog, Eliyahu Sapir and Thomas Frissen discuss the course, […]